Arctic Tracker / Figures
How each figure was generated
How this page was produced derived
Read from figure_provenance.json, generated by the pipeline that produces the figures and copied here byte for byte at commit 70da249, generated 2026-10-21. The copy fails rather than completes if any artifact it names is missing. Nothing on this page is authored in this application.
The thirteen manuscript figures
The manuscript is one product of this dataset, and these are its figures, each listed with what in the dataset it was drawn from, so a figure is checked against the record rather than the record against the figure. A binding ties a figure in the paper to the script that produced it. Confirmed: a named person checked the two against each other. Proposed: a script exists but nobody has checked it yet. Not applicable: the figure is a map or a diagram with no data behind it, so there is nothing to bind.
| Manuscript figure | Stable name | Binding | Pipeline artifact |
|---|---|---|---|
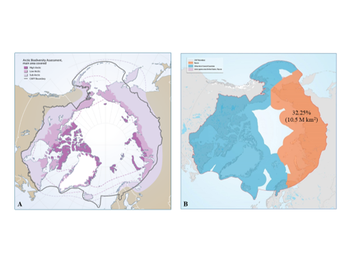
| Figure 1, Arctic definition | arctic-definition | not applicableA hand-drawn map of the Arctic boundary, with no data behind it to trace. | none needed |
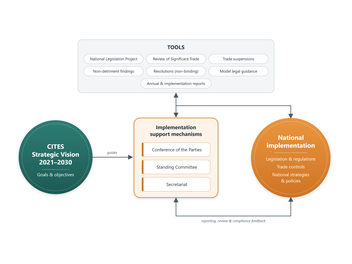
| Figure 2, CITES structure | cites-structure | not applicableA hand-drawn diagram of how the CITES appendices work, with no data behind it to trace. | none needed |
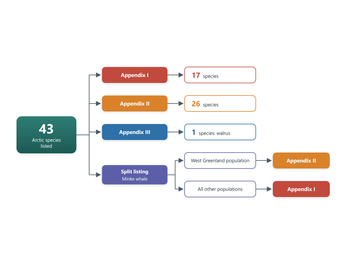
| Figure 3, species and appendices | appendix-membership | proposed, unconfirmed | figureAcomputes the numbers; the artwork is the manuscript's |
| Figure 4, status heatmap | status-heatmap | confirmed | figure5 |
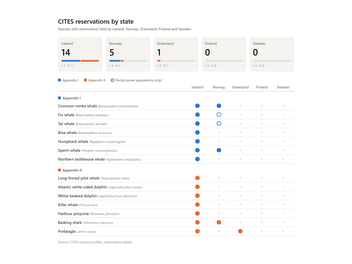
| Figure 5, reservations by state | reservations | proposed, unconfirmed | figureCcomputes the numbers; the artwork is the manuscript's |
| Figure 6, trade volume and status | trade-enforcement | confirmed | figure2 |
| Figure 7, wild-sourced trade volumes | wild-origin-trade | confirmed | figure8 |
| Figure 8, IWT seizures | iwt-seizures | confirmed; counts CITES source-code I records, not the site's seizure dataset | figure7 |
| Figure 9, importing states and partners | trade-partners | confirmed | figure3 |
| Figure 10, status trends | status-trends | confirmed | figure4 |
| Figure 11, status patterns | status-patterns | proposed, unconfirmed | figureBcomputes the numbers; the artwork is the manuscript's |
| Figure 12, what the audit questions measure | pipeline-diagram | not applicableA diagram of what the audit questions measure, with no data behind it to trace. | none needed |
| Figure 13, the evaluation pipeline | pipeline-journal | not applicableA diagram of the evaluation steps, with no data behind it to trace. | none needed |
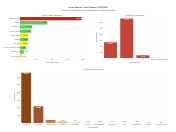
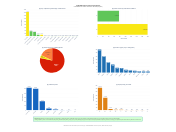
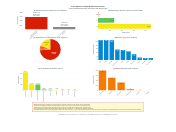
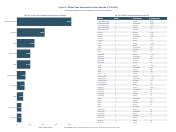
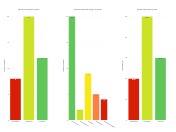
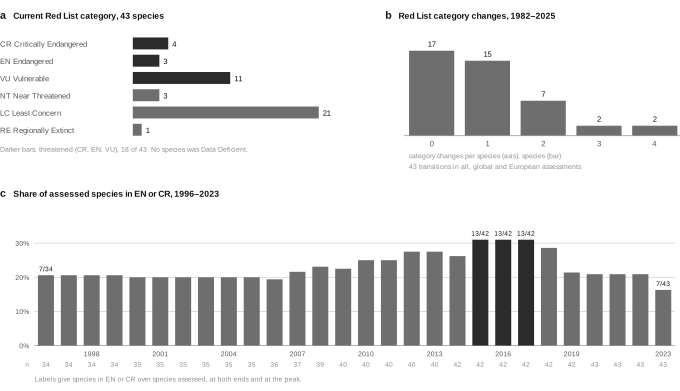
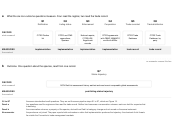
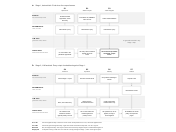
Each figure's own page gives four things: its data inputs, its processing steps, the extent of LLM involvement, and how it was validated. This includes the figures for which no scripted pipeline exists.
Figures are identified here by a stable name, not by their number. The manuscript's figure numbering changed in revision: on 18 October a new Figure 5, the CITES reservations each Arctic state holds, moved every later figure up by one. The pipeline that generates the figures has always used its own numbering, which never matched the manuscript's. Keying provenance to a number that moves is how the two came apart in the first place. Each figure above shows its manuscript number, its stable name, and the evidence binding the two.
Six of thirteen bindings are confirmed
A binding between a manuscript figure and the code that produced it is confirmed only when a named person has checked it against evidence. Six figures are confirmed, three by an exact numeric match between the figure's frozen source data and the manuscript text and three by what the script draws rather than what it emits.
Three further bindings are proposed and not yet confirmed: Figures 3, 5 and 11. Each has a script that computes its numbers from the dataset and deposits them, and draws nothing: the artwork is the authors', and the figure page shows it beside the numbers so the two can be read against each other. No named person has checked these bindings yet, so they are shown as proposed rather than counted with the confirmed.
Four have no binding, and for all four the reason is benign: they are cartographic or schematic figures with no data pipeline to bind to. No data figure is without one.
The tally figure's integers were re-derived from the corpus on 2026-08-11 and agree with the manuscript at 16 Appendix I, 25 Appendix II, 1 Appendix III and 1 split-listed, summing to 43. That verifies the numbers, not the code path, so we do not record it as a binding.
Those four integers hold under a stated counting convention, and the convention is load-bearing rather than incidental: the corpus carries split listings in two shapes, and a reader who counts them the other way gets 15 and 2 instead of 16 and 1. An inspector did, from this same deposit, and read the difference as the figure being wrong. The number is not wrong and the convention is not hidden, but a bare integer in this sentence invited the reading, so the sentence now says where the rule is written down.
How the last three were confirmed, and one of them moved
Three bindings sat unconfirmed until 2026-08-14 for a reason worth stating (the figure numbers here are the manuscript's of 18 October): the frozen numeric source data for pipeline artifacts figure1 and figure2 is byte-identical, and so is the pair figure4 and figure5. Two scripts drawing identical numbers cannot be told apart by their outputs. They were separated by what each one draws instead: figure5 is the only script in the repository that emits a heatmap trace, which binds it to the manuscript's temporal heatmap, and figure4 follows by elimination.
The third moved rather than resolved. The manuscript's trade overview, now Figure 6, had been bound to figure1; the panels figure2 builds are named for three of the four elements in that caption, while figure1 builds wild-origin panels, which belong to the wild-origin figure, now Figure 7, and were already bound elsewhere. The binding was moved to figure2. A provenance record that can be corrected is the point of keeping one.
One figure counts a different thing from this site's seizure pages
Manuscript Figure 8 is built from CITES trade records with the source code I, which marks a specimen whose source was confiscated or seized and which is itself being legally traded. Its Source Data holds ten species, 2,230 records and 712,196 units, and the caption of 18 October states those three numbers and says the code marks a source, not a seizure event.
This site's illegal-trade section uses a different dataset: 919 seizure records from an external compilation, of which 225 survived checking against the taxon they were filed under. These are two sources, two record counts and two definitions of a seizure. The caption now names the one it plots, so a reader can tell them apart, and this section says which is which.