Arctic Tracker / Figures / pipeline-diagram
Figure 12, What the audit questions measure
How this page was produced derived
Read from figure_provenance.json, generated by the pipeline that produces the figures and copied here byte for byte at commit 70da249, generated 2026-10-21. The copy fails rather than completes if any artifact it names is missing. Nothing on this page is authored in this application.
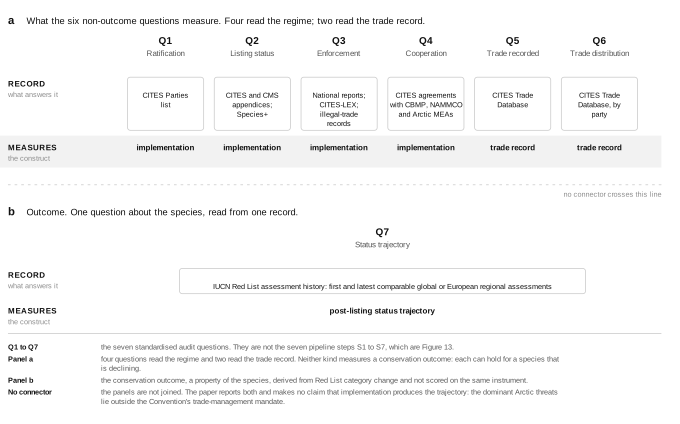
figures/figure12-audit-questions-journal.svg, 12.6 KiB, SHA-256 2fa0b3ecc6b1e5d4. It is shown because the bytes on disk still hash to the value the manifest records; an artifact that had drifted from its digest would not be shown at all. That this file is deposited under this digest is the whole of what showing it claims. It does not establish which code produced the figure, and the record below states what is and is not known about that.pipeline-diagram · no binding established
Binding evidence, as the record states it: NO BINDING ESTABLISHED, and none to establish. Schematic figure: it plots no computed values, so it has no Source Data and no pipeline to bind to. It is drawn by deposit/build_figure12_journal.py, which refuses to build if any connector joins the implementation panel to the outcome panel.
Why there is nothing to download for this figure. It is a schematic figure: a drawing that explains a structure, not a plot of the data. No number in it was computed from the dataset, so there is no source file, no processing chain to trace and nothing to regenerate. That is its finished state, not a gap. What this page can vouch for is below: that no generative model made it.
LLM involvement: none. No generative model produced this figure.
Validation: not applicable. There is no numeric output to verify against a database. It is drawn by a deposited script so that a reader can reconstruct the pipeline without referring to this website.